اصل پیٹرن یعنی ایکچوئل پیٹرن
پیٹرن تصویری صورت یعنی گرافکل ماڈلز ہوتے ہیں جو کہ چارٹ میں قیمت کی جانب سے بنتے ہیں جو کہ ٹیکنیکل تجزیات کے امکانات ، ہسٹری {قیمت کے اتار چڑھاو} چونکہ قیمت اپنے آپ کو دہراتی ہے - جس کا مطلب یہ ہے کہ قیمت کا اتار چڑھا یعنی حرکت ایک جیسے حالات میں ہی عموما مختلف ہوتی ہے جو کہ اس بات کو ممکن بناتی ہے قیمت کے مزید رویہ کی پیشن گوئی کی جاسکے جس کا اُسی طرح ہونے کے امکانات خاصے واضح ہوتے ہیں
Actual Patterns
- All
- Double Top
- Flag
- Head and Shoulders
- Pennant
- Rectangle
- Triangle
- Triple top
- All
- #AAPL
- #AMZN
- #Bitcoin
- #EBAY
- #FB
- #GOOG
- #INTC
- #KO
- #MA
- #MCD
- #MSFT
- #NTDOY
- #PEP
- #TSLA
- #TWTR
- AUDCAD
- AUDCHF
- AUDJPY
- AUDUSD
- EURCAD
- EURCHF
- EURGBP
- EURJPY
- EURNZD
- EURRUB
- EURUSD
- GBPAUD
- GBPCHF
- GBPJPY
- GBPUSD
- GOLD
- NZDCAD
- NZDCHF
- NZDJPY
- NZDUSD
- SILVER
- USDCAD
- USDCHF
- USDJPY
- USDRUB
- All
- M5
- M15
- M30
- H1
- D1
- All
- Buy
- Sale
- All
- 1
- 2
- 3
- 4
- 5

बुलिश फ्लैग पैटर्न NZDCHF पर M5 पर बना है। पैटर्न की निचली सीमा 0.4839/0.4829 पर स्थित है, जबकि उच्च सीमा 0.4849/0.4839 पर स्थित है। फ्लैगपोल का प्रक्षेपण 26 पॉइंट्स
M5 और M15 समय सीमा में अधिक फाल्स एंट्री पॉइंट्स हो सकते हैं।
Open chart in a new window
बुलिश पताका सिग्नल - ट्रेडिंग इंस्ट्रूमेंट NZDCHF M5, निरंतरता पैटर्न। पूर्वानुमान: पैटर्न के उच्च 0.4849 के ऊपर एक खरीद स्थिति सेट करना संभव है, इसके साथ अगला कदम फ्लैगपोल ऊंचाई
M5 और M15 समय सीमा में अधिक फाल्स एंट्री पॉइंट्स हो सकते हैं।
Open chart in a new window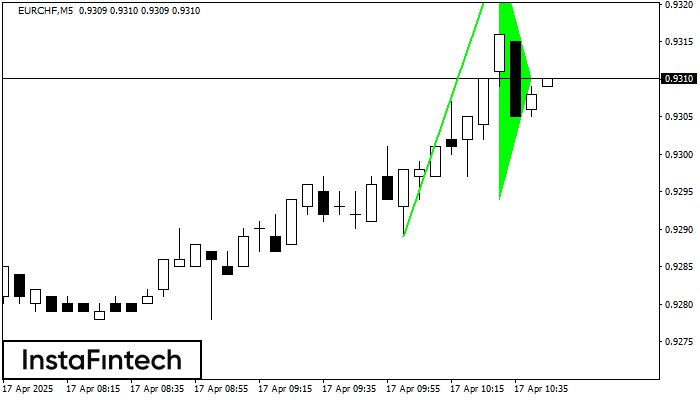
बुलिश पताका पैटर्न EURCHF M5 चार्ट पर बनता है। यह एक प्रकार का निरंतरता पैटर्न है। अगर कीमत पेनेन्ट के उच्च स्तर 0.9326 से ऊपर फिक्स होती है तो
M5 और M15 समय सीमा में अधिक फाल्स एंट्री पॉइंट्स हो सकते हैं।
Open chart in a new window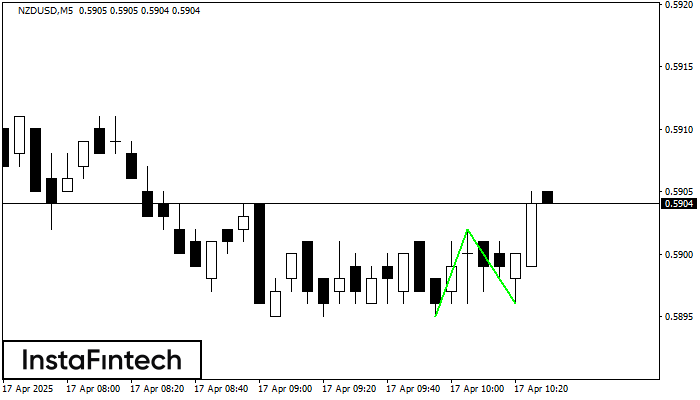
डबल बॉटम पैटर्न NZDUSD M5 पर बना है; ऊपरी सीमा 0.5902 है; निचली सीमा 0.5896 है। पैटर्न की चौड़ाई 7 अंक है। ऊपरी सीमा 0.5902 के टूटने के मामले में
M5 और M15 समय सीमा में अधिक फाल्स एंट्री पॉइंट्स हो सकते हैं।
Open chart in a new window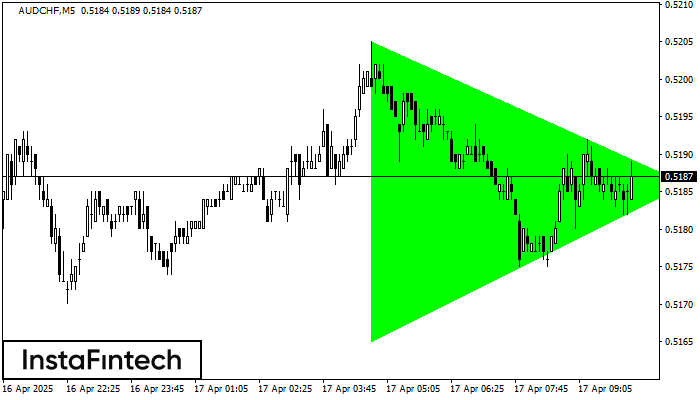
M5 के चार्ट के अनुसार, AUDCHF से बुलिश सिमेट्रिकल त्रिभुज पैटर्न बना। पैटर्न की निचली सीमा ने निर्देशांक 0.5165/0.5186 को स्पर्श किया जबकि ऊपरी सीमा 0.5205/0.5186 के पार गई। यदि
M5 और M15 समय सीमा में अधिक फाल्स एंट्री पॉइंट्स हो सकते हैं।
Open chart in a new window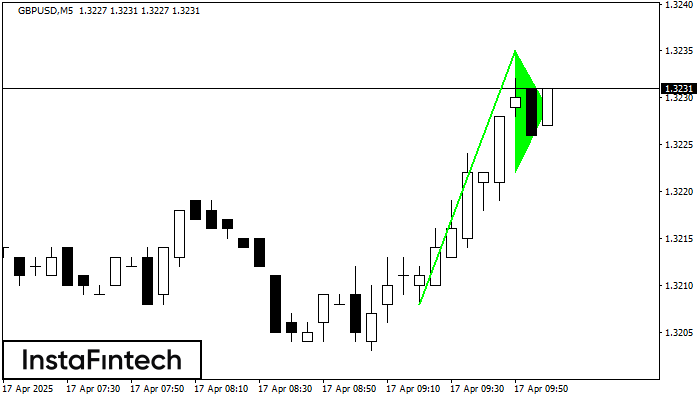
बुलिश पताका ग्राफ़िक पैटर्न GBPUSD M5 इंस्ट्रूमेंट पर बना है। यह निरंतरता पैटर्न की श्रेणी में आता है। इस मामले में, यदि भाव उच्च स्तर पर टूटता है, तो इसके
M5 और M15 समय सीमा में अधिक फाल्स एंट्री पॉइंट्स हो सकते हैं।
Open chart in a new window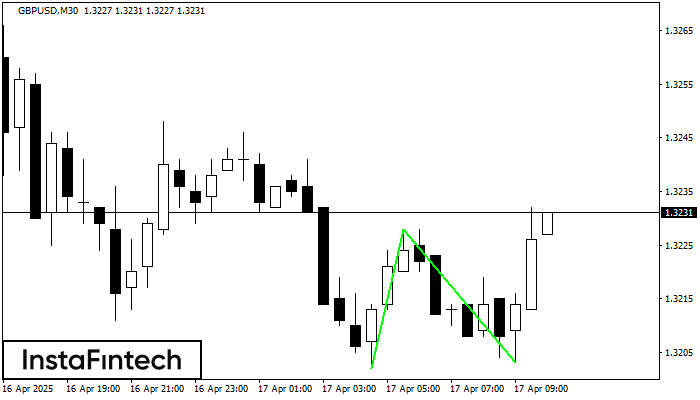
डबल बॉटम पैटर्न GBPUSD M30 पर बना है; ऊपरी सीमा 1.3228 है; निचली सीमा 1.3203 है। पैटर्न की चौड़ाई 26 अंक है। ऊपरी सीमा 1.3228 के टूटने के मामले में
Open chart in a new window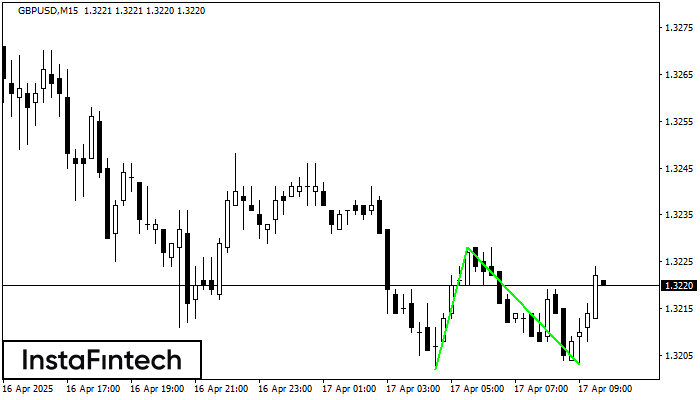
डबल बॉटम पैटर्न GBPUSD M15 पर बना है। यह फॉर्मेशन नीचे से ऊपर की ओर प्रवृत्ति के उलट होने का संकेत देता है। संकेत यह है कि पैटर्न 1.3228 की
M5 और M15 समय सीमा में अधिक फाल्स एंट्री पॉइंट्स हो सकते हैं।
Open chart in a new window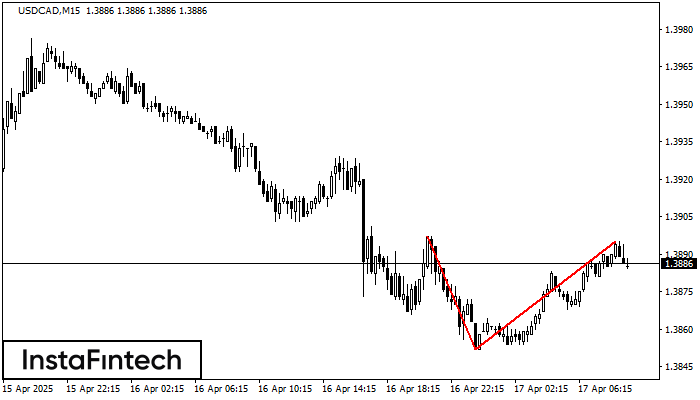
USDCAD M15 के चार्ट पर डबल टॉप रीवर्सल पैटर्न बना है। विशेषताएं: ऊपरी सीमा 1.3895; निचली सीमा 1.3852; पैटर्न की चौड़ाई 43 पॉइंट्स। संकेत: निचली सीमा के टूटने से 1.3829
M5 और M15 समय सीमा में अधिक फाल्स एंट्री पॉइंट्स हो सकते हैं।
Open chart in a new window