

сила сигнала 1 из 5
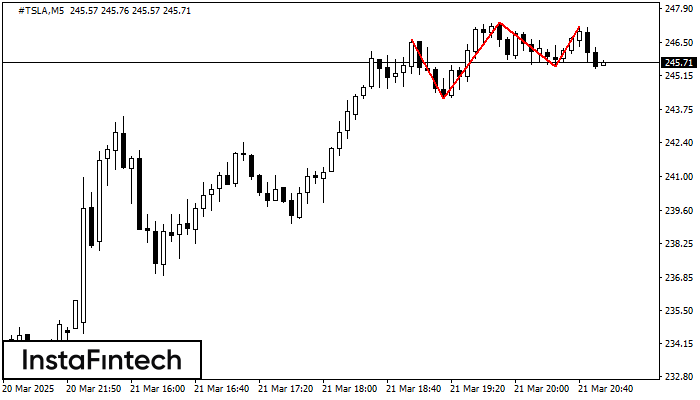
По #TSLA на M5 сформировалась фигура «Тройная вершина». Характеристика: Границы имеют восходящий угол. Нижняя граница фигуры имеет координаты 244.22/245.52, при этом верхняя граница 246.65/247.16. Проекция ширины 243 пунктов. Формирование фигуры «Тройная вершина» наиболее вероятным образом свидетельствует об изменении тренда с восходящего на нисходящий. Это означает, что, в случае пробоя нижней границы 245.52, курс, с наибольшей вероятностью, продолжит нисходящее движение.
Таймфреймы М5 и М15 могут иметь больше ложных точек входа.
Шунингдек кўринг
- Все
- Вымпел
- Голова и плечи
- Двойная вершина
- Прямоугольник
- Треугольник
- Тройная вершина
- Флаг
- Все
- #AAPL
- #AMZN
- #Bitcoin
- #EBAY
- #FB
- #GOOG
- #INTC
- #KO
- #MA
- #MCD
- #MSFT
- #NTDOY
- #PEP
- #TSLA
- #TWTR
- AUDCAD
- AUDCHF
- AUDJPY
- AUDUSD
- EURCAD
- EURCHF
- EURGBP
- EURJPY
- EURNZD
- EURRUB
- EURUSD
- GBPAUD
- GBPCHF
- GBPJPY
- GBPUSD
- GOLD
- NZDCAD
- NZDCHF
- NZDJPY
- NZDUSD
- SILVER
- USDCAD
- USDCHF
- USDJPY
- USDRUB
- Все
- M5
- M15
- M30
- H1
- D1
- Все
- Покупка
- Продажа
- Все
- 1
- 2
- 3
- 4
- 5
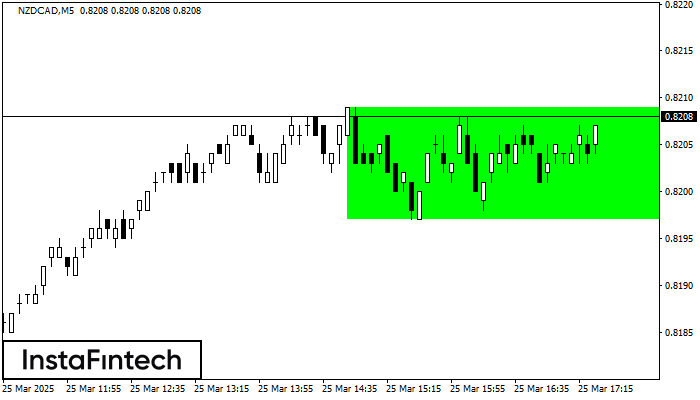
According to the chart of M5, NZDCAD formed the Bullish Rectangle. This type of a pattern indicates a trend continuation. It consists of two levels: resistance 0.8209 and support 0.8197
The M5 and M15 time frames may have more false entry points.
Open chart in a new window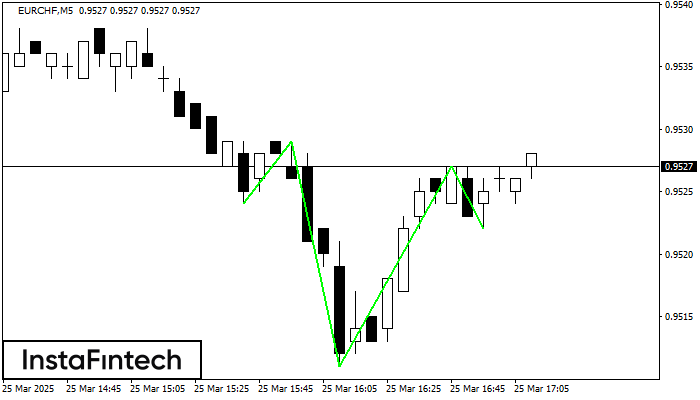
According to the chart of M5, EURCHF produced the pattern termed the Inverse Head and Shoulder. The Head is fixed at 0.9511 while the median line of the Neck
The M5 and M15 time frames may have more false entry points.
Open chart in a new window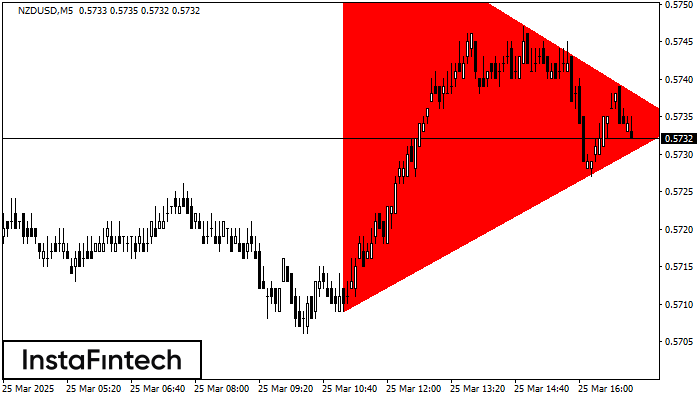
According to the chart of M5, NZDUSD formed the Bearish Symmetrical Triangle pattern. Trading recommendations: A breach of the lower border 0.5709 is likely to encourage a continuation
The M5 and M15 time frames may have more false entry points.
Open chart in a new window


