empty
23.01.2025 11:29 AM
S&P 500 at peak, with bear market signals emerging

This image is no longer relevant

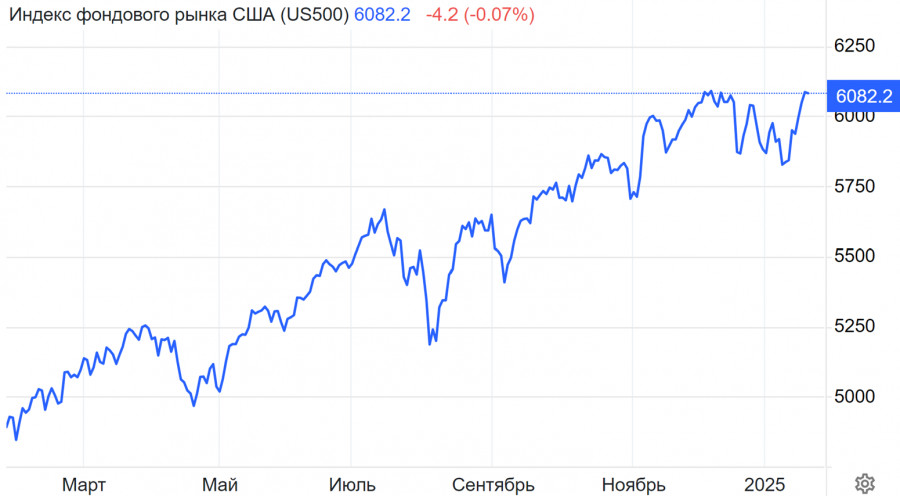
Futures on US equities remained almost unchanged on Thursday following a strong rally in the previous session that saw the S&P 500 index hit a new all-time high. However, this comes as no surprise to market participants. Such a strong rally can be attributed to a robust earnings season as well as optimism surrounding deregulation and tax cuts under the Trump administration. These factors continue to support bullish sentiment.

Fundamental background

Netflix soared nearly 10% after reporting record subscriber growth, confirming strong demand for digital content and the ongoing trend toward digital consumption.

Procter & Gamble gained 1.9% after the company posted strong quarterly results, indicating sustained demand for consumer goods, even amidst rising competition.

Oracle surged by 6.8% after announcing a $500 billion AI joint venture with SoftBank and OpenAI, boosting market confidence in the long-term potential of AI.

Macroeconomic expectations

Investors remain optimistic about further tax cuts and deregulation, expecting additional economic acceleration.

Labor market data, particularly initial jobless claims, continues to be closely watched as it provides insight into employment conditions and indirectly affects consumer spending.

Technical analysis

The S&P 500 recently broke through the resistance levels of 6,000 and 6,060, accelerating the ongoing intermediate upside momentum that began in early January.

Given the sustained bullish trend and overall positive market sentiment, the next target appears to be around 6,110, where a short-term pullback is possible.

If buying momentum remains strong, the next areas of interest will be 6,200 and then 6,400–6,500. However, according to wave structure analysis, the range of 6,400–6,500 could mark the start of a more significant correction or even a shift into a long-term bearish phase.

This image is no longer relevant

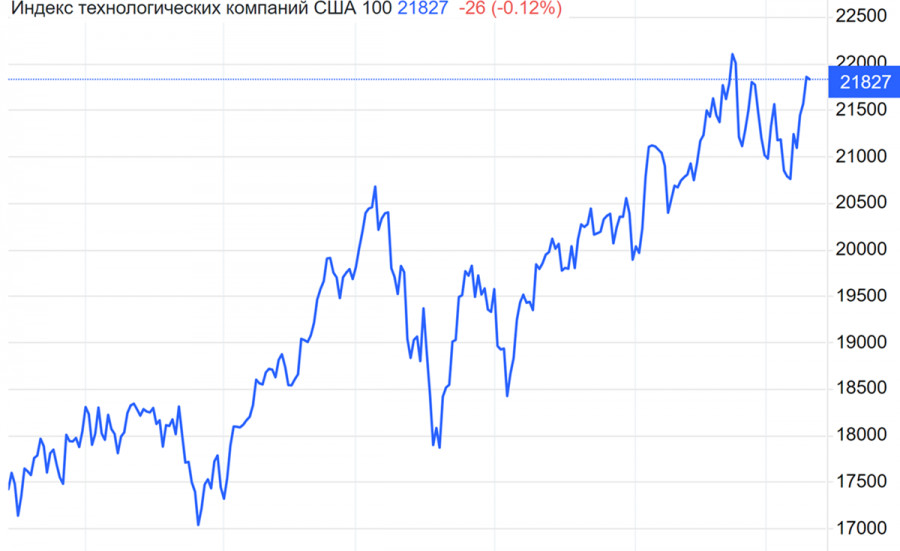
The Nasdaq Composite closed at 21,820 on Wednesday, adding 286 points, or 1.33%.

Over the past four weeks, the Nasdaq has seen a modest rise (+0.10%), which could signal some consolidation after previous gains.

The annual growth of 24% reflects a strong trend over the past 12 months. However, forecasts for the end of the quarter (20,615) and the end of next year (19,355) suggest the possibility of a correction phase.

From a wave theory perspective, the market may be nearing the final stage of a major upward wave, making it crucial for investors to monitor the index's reaction as it approaches key psychological levels.

This image is no longer relevant

Conclusion for traders and investors

Short-term outlook:The S&P 500 and Nasdaq remain in a bullish trend, supported by positive earnings reports and expectations of stimulus measures. Traders could consider buying on corrections to support levels if their strategy involves short-term trend trading.

Medium-term and long-term outlook:If the S&P 500 reaches the key resistance levels of 6,200–6,500, and the Nasdaq potentially falls to 20,600–19,350, it may be time to reassess portfolios. Adding to short positions or locking in profits could be a sensible strategy if a downward correction begins.

Risks

  • Potential overvaluation of high-tech companies (growth in market capitalization not always supported by fundamental metrics).
  • Uncertainty surrounding the implementation of political promises regarding deregulation and tax incentives.
  • Potential geopolitical factors that could trigger increased volatility in the short term.

For investors focused on longer time horizons, it is essential to stay attuned to key macro and microeconomic indicators, as strong resistance levels and overheating in certain market sectors could trigger significant corrections.

For day traders and those focused on shorter timeframes, it may make sense to continue trading with the trend, but as soon as there are signs of weakening momentum, it is crucial to shift to more conservative positions or use stop-loss orders.

Pilih carta masa
5
min
15
min
30
min
1
jam
4
jam
1
hari
1
minggu
Jana pendapatan melalui perubahan kadar mata wang kripto dengan InstaForex.
Muat turun MetaTrader 4 dan buka dagangan pertama anda.
  • Grand Choice
    Contest by
    InstaForex
    InstaForex always strives to help you
    fulfill your biggest dreams.
    SERTAI PERADUAN

Artikel yang dicadangkan

GBP/USD. Analisis dan Ramalan

Hari ini, pasangan GBP/USD menunjukkan pertumbuhan kukuh, mencapai paras yang kali terakhir dicatatkan pada Oktober 2024. Kenaikan ini didorong oleh momentum menurun dalam dolar AS, yang telah mewujudkan keadaan yang

Irina Yanina 11:00 2025-04-03 UTC+2

USD/JPY: Petua Dagangan Ringkas kepada Pedagang Baharu pada 3 April. Semakan Dagangan Forex Semalam

Analisis Dagangan dan Petua Dagangan bagi Yen Jepun Ujian harga pada paras 149.49 berlaku apabila penunjuk MACD baru sahaja mula bergerak naik dari garis sifar, sekali gus mengesahkan kesahihan titik

Jakub Novak 09:02 2025-04-03 UTC+2

GBP/USD: Petua Dagangan Ringkas kepada Pedagang Baharu pada 3 April. Semakan Dagangan Forex Semalam

Analisis Dagangan dan Petua Dagangan untuk Pound British Ujian harga pada paras 1.2952 berlaku apabila penunjuk MACD baru sahaja mula meningkat dari garis sifar. Ini mengesahkan kesahihan titik kemasukan untuk

Jakub Novak 09:02 2025-04-03 UTC+2

EUR/USD: Petua Dagangan Ringkas kepada Pedagang Baharu pada 3 April. Semakan Dagangan Forex Semalam

Analisis Dagangan dan Nasihat Dagangan untuk Euro Ujian harga pada paras 1.0815 berlaku apabila penunjuk MACD telah bergerak jauh di atas tanda sifar, yang mengehadkan potensi kenaikan pasangan mata wang

Jakub Novak 09:02 2025-04-03 UTC+2

Strategi Intraday untuk Pedagang Baharu pada 3 April

Euro dan pound menyambung semula kenaikan selepas berita bahawa tarif perdagangan balas yang dikenakan oleh Amerika Syarikat adalah lebih kurang sejajar dengan jangkaan pasaran. Walaupun pasaran saham AS berdepan

Miroslaw Bawulski 08:01 2025-04-03 UTC+2

USD/JPY: Petua Dagangan Ringkas kepada Pedagang Baharu pada 2 April (Sesi Urusniaga Amerika Syarikat)

Analisis Dagangan dan Petua untuk Berdagang Yen Jepun Ujian harga pada paras 149.69 berlaku apabila penunjuk MACD telah pun bergerak jauh di bawah garis sifar, yang telah mengehadkan potensi penurunan

Jakub Novak 20:14 2025-04-02 UTC+2

GBP/USD: Petua Dagangan Ringkas kepada Pedagang Baharu pada 2 April (Sesi Urusniaga Amerika Syarikat)

Pecahan Dagangan dan Petua untuk Berdagang Mata Wang British Pound Ujian harga pada paras 1.2905 berlaku apabila penunjuk MACD telah pun bergerak jauh di bawah garis sifar, yang telah mengehadkan

Jakub Novak 20:12 2025-04-02 UTC+2

EUR/USD: Petua Dagangan Ringkas kepada Pedagang Baharu pada 2 April (Sesi Urusniaga Amerika Syarikat)

Pecahan Dagangan dan Petua untuk Berdagang Euro Ujian harga pada paras 1.0803 berlaku apabila penunjuk MACD telah pun bergerak jauh di atas garis sifar, yang telah mengehadkan potensi kenaikan pasangan

Jakub Novak 20:09 2025-04-02 UTC+2

USD/CAD. Analisis dan Ramalan

Hari ini, pasangan USD/CAD sedang berusaha menghentikan kejatuhan terdahulu dengan percbaan untuk bertapak kukuh di atas paras 1.4300. Pengumuman yang dinanti-nantikan daripada Presiden AS Donald Trump mengenai tarif, dijangka berlaku

Irina Yanina 12:22 2025-04-02 UTC+2

USD/JPY: Petua Dagangan Ringkas kepada Pedagang Baharu pada 2 April. Semakan Dagangan Forex Semalam

Analisis Dagangan dan Petua Berdagang untuk Yen Jepun Ujian harga pada paras 149.27 berlaku apabila penunjuk MACD telah pun bergerak jauh di bawah garis sifar, yang mengehadkan potensi penurunan pasangan

Jakub Novak 08:50 2025-04-02 UTC+2
Tidak boleh bertanya sekarang?
Tanya soalan anda di Ruangan bersembang.
Panggilan semula Widget
 

Dear visitor,

Your IP address shows that you are currently located in the USA. If you are a resident of the United States, you are prohibited from using the services of InstaFintech Group including online trading, online transfers, deposit/withdrawal of funds, etc.

If you think you are seeing this message by mistake and your location is not the US, kindly proceed to the website. Otherwise, you must leave the website in order to comply with government restrictions.

Why does your IP address show your location as the USA?

  • - you are using a VPN provided by a hosting company based in the United States;
  • - your IP does not have proper WHOIS records;
  • - an error occurred in the WHOIS geolocation database.

Please confirm whether you are a US resident or not by clicking the relevant button below. If you choose the wrong option, being a US resident, you will not be able to open an account with InstaForex anyway.

We are sorry for any inconvenience caused by this message.