empty
30.03.2023 01:28 PM
Technical analysis of BTC/USD for March 30, 2023

This image is no longer relevant

Trading BTC/USD :

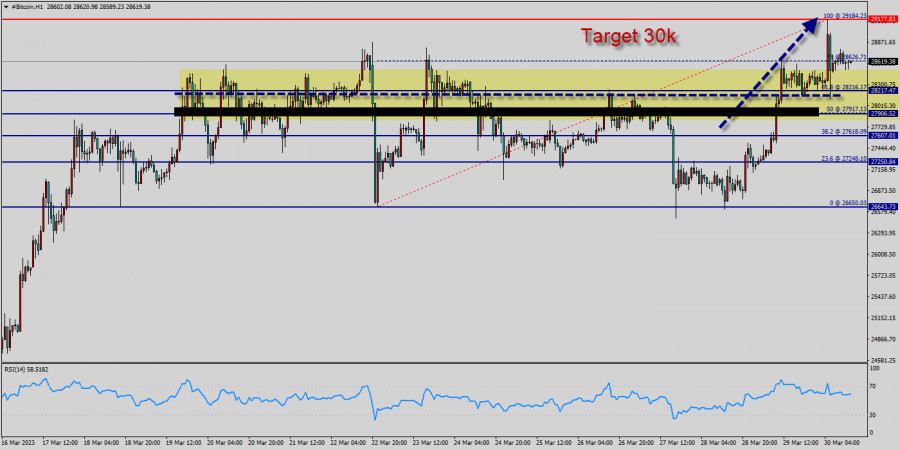
Bitcoin The bullish trend is currently very strong for BITCOIN - BTC/USD. As long as the price remains above the support at 28k USD, you could try to take advantage of the bullish rally in short term. The first bullish objective is located at 28,626 USD (this price is coincided with the ratio 78% of Fibonacci retracement levels).

The bullish momentum would be revived by a break in this resistance. Closing above the pivot point (28k USD) could assure that BTC/USD will move higher towards cooling new highs. The bulls must break through 29k USD in order to resume the up trend. Buyers would then use the next resistance located at 29,184 USD as an objective (this price is coincided with the ratio 100% of Fibonacci retracement levels - the double top - te last bullish wave on the hourly chart).

Crossing it would then enable buyers to target 29k USD. Be careful, given the powerful bullish rally underway, excesses could lead to a short-term rebound. Bitcoin's price has been consolidating between the 28k USD and 30k USD over the last few weeks, following a massive rising from the 28k USD mark.

So far, the price has been supported by the 28k USD - 27k USD range. If this is the case, remember that trading against the trend may be riskier. It would seem more appropriate to wait for a signal indicating reversal of the trend.

However, considering the current price action and the third rejection from this area, a run to the 29k USD support level and the 50-day moving average seems more likely. A bullish breakout from these levels would initiate a rally towards the 29k USD - 30k USD supply zone – a key level to which the price's reaction would determine the mid-term trend of the market.

In the very short term, the general bearish sentiment is confirmed by technical indicators. Nevertheless, a small upwards rebound in the very short term could occur in case of excessive bearish movements.

After finding bids reach to 29k USD, bitcoin price recovered above 26k USD, 27k USD and 28k USD. Initial Bitcoin resistance lies near the 28,626 USD level (78% of Fibonacci retracement levels).

A decent breakout and follow-up move above 28,626 USD could open the gate for a push towards the 29k USD level. The main resistance remains near the area of 29k USD - 30k USD.

Also it should be noted that Bitcoin and cryptocurrencies unite as the bears lose their momentum. The market is indicating a bullish opportunity above the above-mentioned support levels, for that the bullish outlook remains the same as long as the 100 EMA is headed to the upside.

Trading BTC/USD :

An uptrend will start as soon, as the market rises above resistance level 28k USD, which will be followed by moving up to resistance level 29k USD. Further close above the high end may cause a rally towards 30k USD. Nonetheless, the weekly resistance level and zone should be considered.

Pilih carta masa
5
min
15
min
30
min
1
jam
4
jam
1
hari
1
minggu
Jana pendapatan melalui perubahan kadar mata wang kripto dengan InstaForex.
Muat turun MetaTrader 4 dan buka dagangan pertama anda.
  • Grand Choice
    Contest by
    InstaForex
    InstaForex always strives to help you
    fulfill your biggest dreams.
    SERTAI PERADUAN

Artikel yang dicadangkan

Ramalan untuk EUR/USD pada 14 April 2025

Pada hari Jumaat, pasangan EUR/USD terus meningkat tetapi berundur pada separuh kedua hari tersebut. Penurunan (iaitu pengukuhan dolar) adalah singkat, dan menjelang penghujung Jumaat, dolar AS sekali lagi mencatatkan kerugian

Samir Klishi 12:28 2025-04-14 UTC+2

Ramalan untuk GBP/USD pada 14 April 2025

Pada carta per jam, pasangan GBP/USD meneruskan pergerakan menaiknya pada hari Jumaat dan hari ini menuju ke tahap 1.3151. Pembalikan dari tahap ini akan memihak kepada dolar AS dan berkemungkinan

Samir Klishi 12:25 2025-04-14 UTC+2

Analisis Teknikal Pergerakan Harga Intraday Instrumen Komoditi Minyak Mentah, Isnin 24 April 2025.

Pada carta 4 jam bagi instrumen komoditi Minyak Mentah, terdapat corak Inverted Head & Shoulders serta Corak 123 Menaik dan Perbezaan (Divergence) antara pergerakan harga #CL dengan penunjuk Pengayun Stochastic

Arief Makmur 07:19 2025-04-14 UTC+2

Analisis Teknikal Pergerakan Harga Harian Instrumen Komoditi Palladium vs USD, Isnin 24 April 2025.

Dengan kemunculan Divergence dari penunjuk Pengayun Stochastic dengan pergerakan harga XPD/USD pada carta 4-jamannya dan kemunculan corak Bullish 123 diikuti oleh pergerakan harganya yang bergerak di atas EMA (21) memberi

Arief Makmur 07:19 2025-04-14 UTC+2

#SPX – Ringkasan dan Tinjauan

Minggu lalu, walaupun terdapat jurang menurun, pasaran kenaikan harga berjaya mendapatkan semula kedudukan mereka dengan berkesan. Pasaran kini semakin menghampiri titik di mana ia mungkin menghapuskan death cross Ichimoku harian

Evangelos Poulakis 00:58 2025-04-14 UTC+2

Isyarat Dagangan EUR/USD untuk 11-15 April 2025: jual di bawah 1.1470 (+2/8 Murray - terlebih beli)

Semasa sesi dagangan Eropah, euro telah mencapai paras tertinggi baharu sekitar +2/8 Murray, yang terletak pada 1.1473. Pergerakan pasangan EUR/USD ini berlaku selepas pengumuman oleh Kementerian Kewangan China bahawa Beijing

Dimitrios Zappas 16:44 2025-04-11 UTC+2

Isyarat Dagangan untuk EMAS (XAU/USD) bagi 11-13 April, 2025: jual di bawah $3,235 (+1/8 Murray - terlebih beli)

Pada sesi Amerika awal, emas sedang mengalami pembetulan teknikal yang kuat setelah mencapai paras tertinggi baharu sekitar 3,237.69 buat masa kini. Data ekonomi dari Amerika Syarikat akan dikeluarkan dalam beberapa

Dimitrios Zappas 16:04 2025-04-11 UTC+2

EUR/USD – 11 April. Penurunan Dolar Nampaknya Tiada Tanda Akan Berhenti

Pada hari Khamis, pasangan EUR/USD menghabiskan sepanjang hari dengan pergerakan menaik, memperoleh 400 mata dan menghampiri tahap pembetulan Fibonacci 261.8% pada 1.1318. Lantunan daripada tahap ini atau dari 1.1374 akan

Samir Klishi 12:36 2025-04-11 UTC+2

Ramalan untuk GBP/USD pada 11 April 2025

Pada carta setiap jam, pasangan GBP/USD meneruskan pergerakan menaiknya pada hari Khamis dan berjaya berada di atas tahap pembetulan 127.2% pada 1.3003 – menjelang pagi Jumaat. Ini menunjukkan bahawa pergerakan

Samir Klishi 12:32 2025-04-11 UTC+2

Ramalan EUR/USD untuk 11 April 2025

Sepanjang hari semalam dan pagi ini, euro telah mencapai julat sasaran 1.1385–1.1420, sepadan dengan paras tertinggi pada Jun 2019 dan 2020. Garis isyarat pengayun Marlin telah memperlahankan kenaikan dalam

Laurie Bailey 05:03 2025-04-11 UTC+2
Tidak boleh bertanya sekarang?
Tanya soalan anda di Ruangan bersembang.
Panggilan semula Widget
 

Dear visitor,

Your IP address shows that you are currently located in the USA. If you are a resident of the United States, you are prohibited from using the services of InstaFintech Group including online trading, online transfers, deposit/withdrawal of funds, etc.

If you think you are seeing this message by mistake and your location is not the US, kindly proceed to the website. Otherwise, you must leave the website in order to comply with government restrictions.

Why does your IP address show your location as the USA?

  • - you are using a VPN provided by a hosting company based in the United States;
  • - your IP does not have proper WHOIS records;
  • - an error occurred in the WHOIS geolocation database.

Please confirm whether you are a US resident or not by clicking the relevant button below. If you choose the wrong option, being a US resident, you will not be able to open an account with InstaForex anyway.

We are sorry for any inconvenience caused by this message.