signal strength 1 of 5
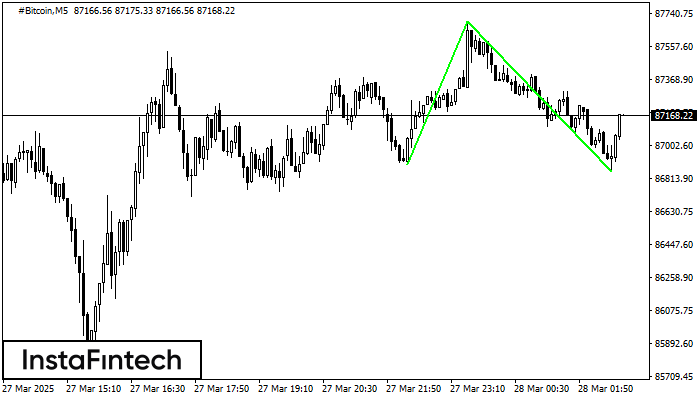
The Double Bottom pattern has been formed on #Bitcoin M5. Characteristics: the support level 86893.54; the resistance level 87696.01; the width of the pattern 80247 points. If the resistance level is broken, a change in the trend can be predicted with the first target point lying at the distance of 84049 points.
The M5 and M15 time frames may have more false entry points.
See Also
- All
- Double Top
- Flag
- Head and Shoulders
- Pennant
- Rectangle
- Triangle
- Triple top
- All
- #AAPL
- #AMZN
- #Bitcoin
- #EBAY
- #FB
- #GOOG
- #INTC
- #KO
- #MA
- #MCD
- #MSFT
- #NTDOY
- #PEP
- #TSLA
- #TWTR
- AUDCAD
- AUDCHF
- AUDJPY
- AUDUSD
- EURCAD
- EURCHF
- EURGBP
- EURJPY
- EURNZD
- EURRUB
- EURUSD
- GBPAUD
- GBPCHF
- GBPJPY
- GBPUSD
- GOLD
- NZDCAD
- NZDCHF
- NZDJPY
- NZDUSD
- SILVER
- USDCAD
- USDCHF
- USDJPY
- USDRUB
- All
- M5
- M15
- M30
- H1
- D1
- All
- Buy
- Sale
- All
- 1
- 2
- 3
- 4
- 5
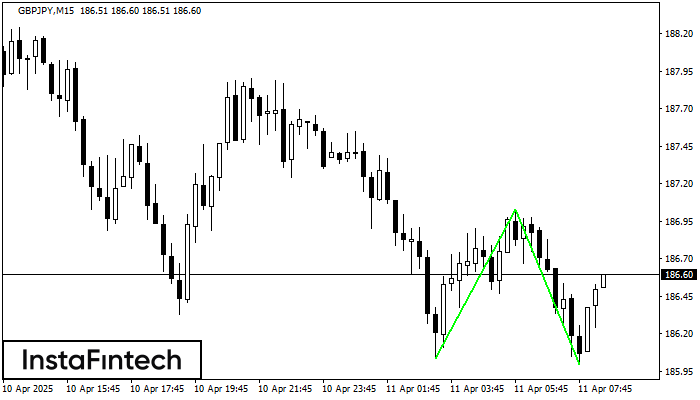
The Double Bottom pattern has been formed on GBPJPY M15; the upper boundary is 187.03; the lower boundary is 186.00. The width of the pattern is 99 points. In case
The M5 and M15 time frames may have more false entry points.
Открыть график инструмента в новом окне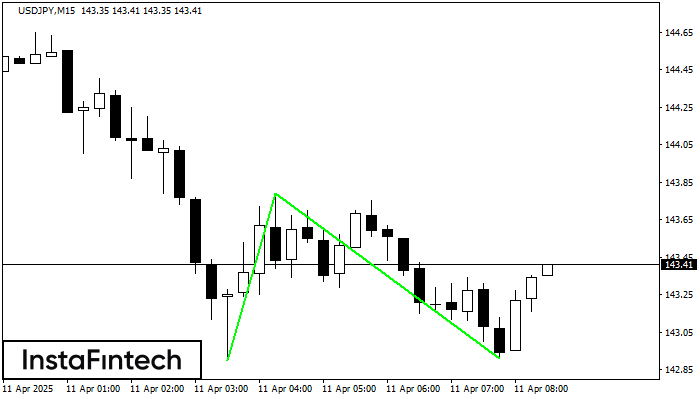
The Double Bottom pattern has been formed on USDJPY M15; the upper boundary is 143.79; the lower boundary is 142.91. The width of the pattern is 89 points. In case
The M5 and M15 time frames may have more false entry points.
Открыть график инструмента в новом окне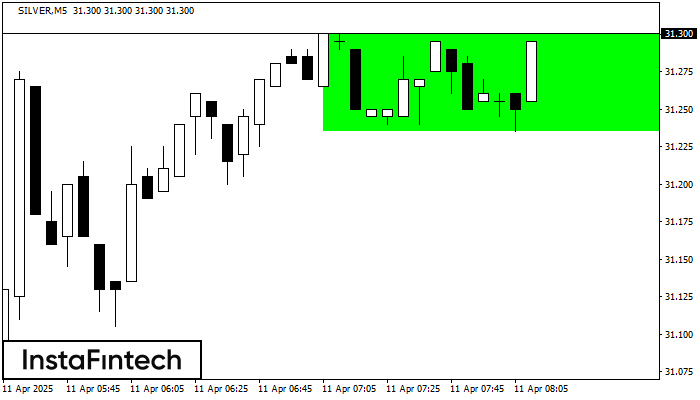
According to the chart of M5, SILVER formed the Bullish Rectangle. The pattern indicates a trend continuation. The upper border is 31.30, the lower border is 31.23. The signal means
The M5 and M15 time frames may have more false entry points.
Открыть график инструмента в новом окне