


signal strength 1 of 5
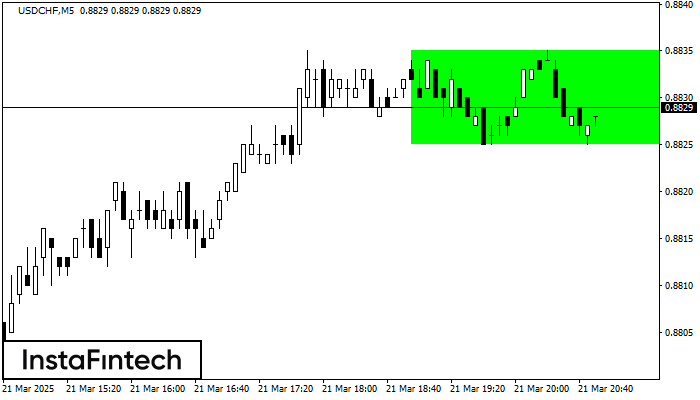
According to the chart of M5, USDCHF formed the Bullish Rectangle which is a pattern of a trend continuation. The pattern is contained within the following borders: the lower border 0.8825 – 0.8825 and upper border 0.8835 – 0.8835. In case the upper border is broken, the instrument is likely to follow the upward trend.
The M5 and M15 time frames may have more false entry points.
See Also
- All
- Double Top
- Flag
- Head and Shoulders
- Pennant
- Rectangle
- Triangle
- Triple top
- All
- #AAPL
- #AMZN
- #Bitcoin
- #EBAY
- #FB
- #GOOG
- #INTC
- #KO
- #MA
- #MCD
- #MSFT
- #NTDOY
- #PEP
- #TSLA
- #TWTR
- AUDCAD
- AUDCHF
- AUDJPY
- AUDUSD
- EURCAD
- EURCHF
- EURGBP
- EURJPY
- EURNZD
- EURRUB
- EURUSD
- GBPAUD
- GBPCHF
- GBPJPY
- GBPUSD
- GOLD
- NZDCAD
- NZDCHF
- NZDJPY
- NZDUSD
- SILVER
- USDCAD
- USDCHF
- USDJPY
- USDRUB
- All
- M5
- M15
- M30
- H1
- D1
- All
- Buy
- Sale
- All
- 1
- 2
- 3
- 4
- 5
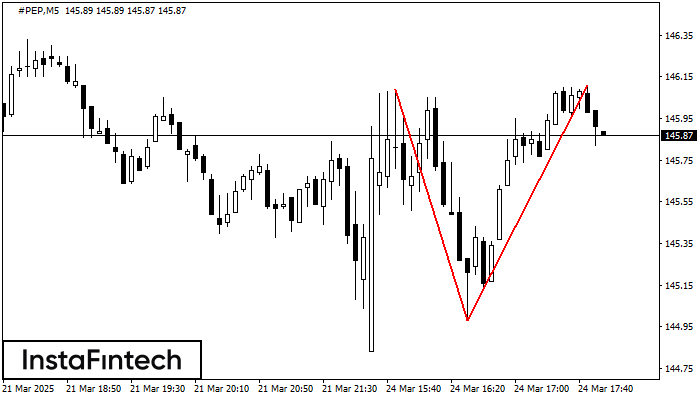
The Double Top reversal pattern has been formed on #PEP M5. Characteristics: the upper boundary 146.09; the lower boundary 144.98; the width of the pattern is 113 points. Sell trades
The M5 and M15 time frames may have more false entry points.
Open chart in a new window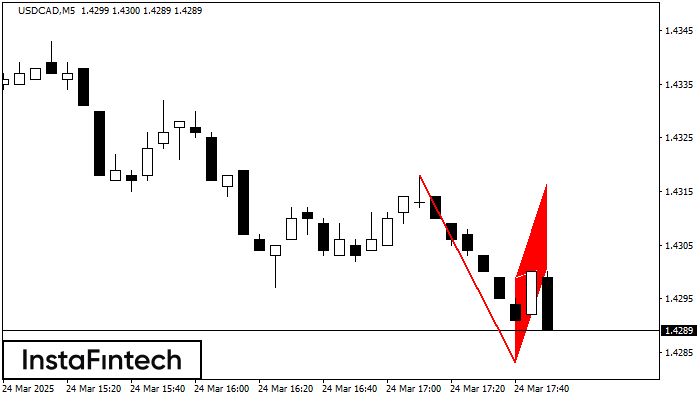
The Bearish Flag pattern has been formed on USDCAD at M5. The lower boundary of the pattern is located at 1.4283/1.4301 while the upper boundary lies at 1.4299/1.4317. The projection
The M5 and M15 time frames may have more false entry points.
Open chart in a new window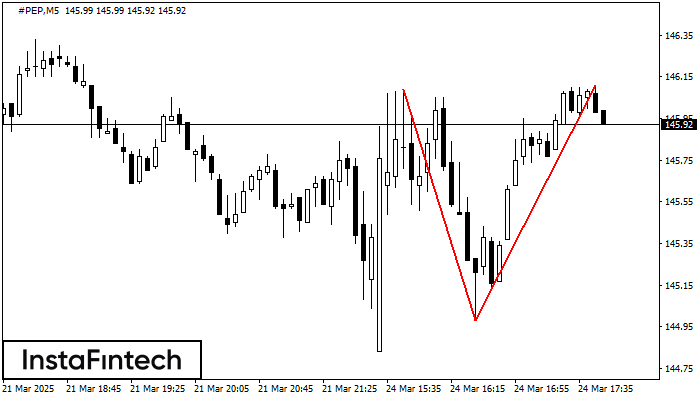
On the chart of #PEP M5 the Double Top reversal pattern has been formed. Characteristics: the upper boundary 146.11; the lower boundary 144.98; the width of the pattern 113 points
The M5 and M15 time frames may have more false entry points.
Open chart in a new window


