Analysis of Tuesday's trades:
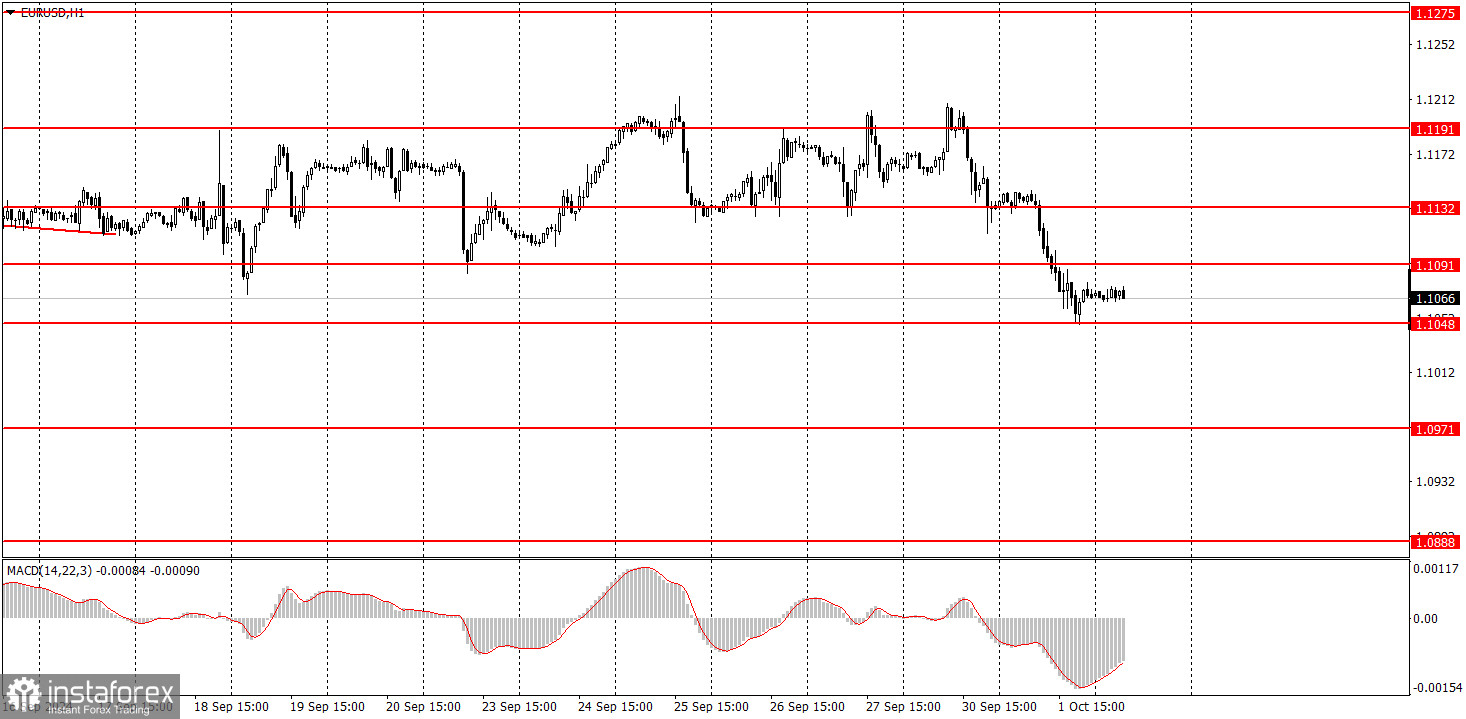
1H EUR/USD chart:
On Tuesday, the EUR/USD pair sharply dropped and broke out of the horizontal channel 1.1091-1.1191. As mentioned before, we expect only a decline in the European currency. We see no reason for the euro to continue rising or the dollar to keep falling. Over the past two years, the market has already priced in the entire cycle of the Federal Reserve's rate cuts. Yesterday (and Monday), there were plenty of reasons for the US dollar to rise. First, inflation in the Eurozone slowed below 2%, which means the European Central Bank could lower its rate faster than once every two meetings. On top of that, Fed Chair Jerome Powell dismissed the possibility of a 0.5% rate cut in November, and the first significant labor market report, JOLTs, showed a higher-than-expected value. However, we believe that the dollar should rise even without macroeconomic support.
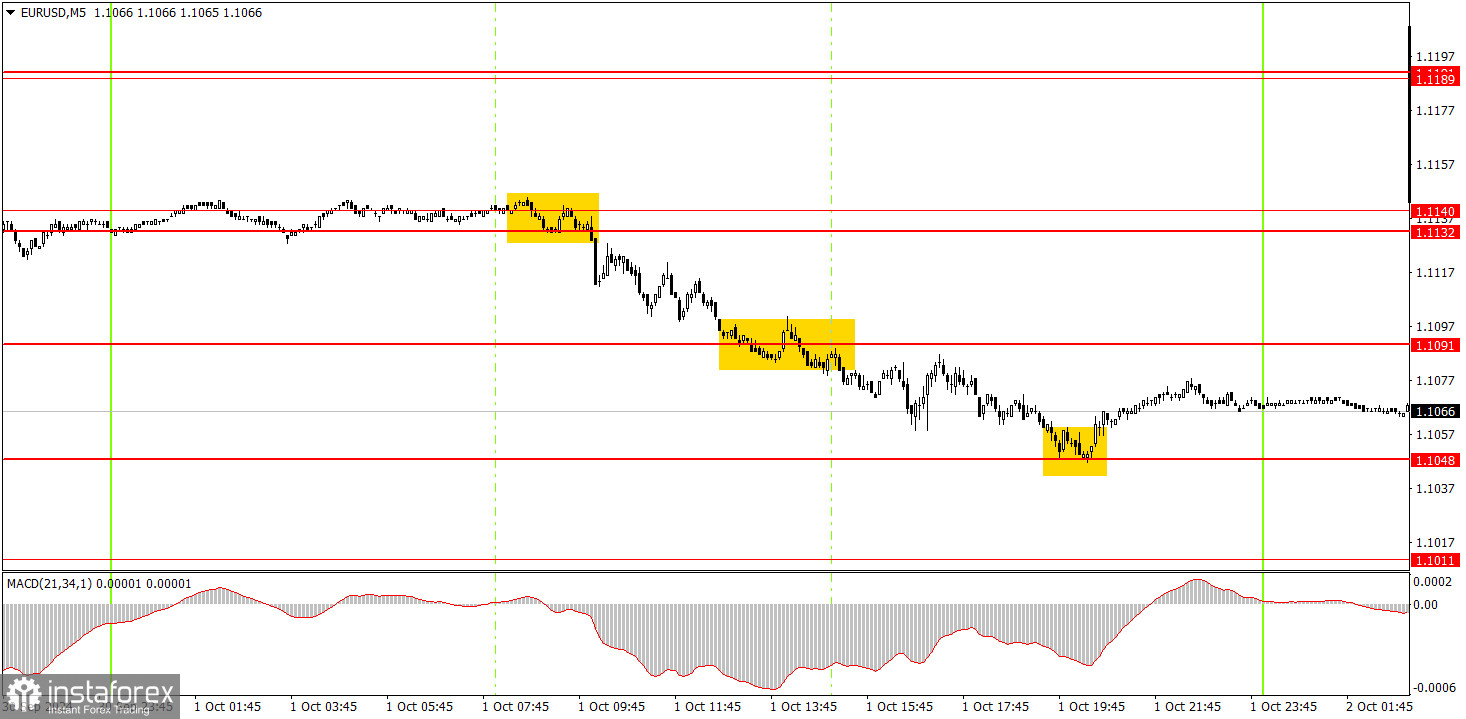
5M EUR/USD chart:
Three trading signals were generated in the 5-minute time frame on Tuesday. The pair's decline started during the European session and continued throughout the day. Therefore, short positions could already be opened after consolidating below the 1.1132-1.1140 area. The price then quickly broke through the 1.1091 level and tested the next level at 1.1048, from which it bounced. This is where profits could have been taken.
How to trade on Wednesday:
In the hourly time frame, the EUR/USD pair still has a chance to form a downtrend; this week, it has taken the first step in that direction. Unfortunately, illogical sales of the dollar could quickly resume in the medium term, as no one knows how long the market will continue to react to the Fed's monetary easing while ignoring all factors in favor of the dollar. Over the past few weeks, it has become clear that market participants are struggling to push the pair further upward. We may be nearing the end of the uptrend, but important US reports are due this week.
On Wednesday, trading can be based on the 1.1048 level. The price has exited the flat, which means the decline may continue. However, it's worth noting that many significant reports coming out of the US this week could be weak and trigger a new decline in the dollar.
In the 5-minute time frame, the levels to consider are 1.0726-1.0733, 1.0797-1.0804, 1.0838-1.0856, 1.0888-1.0896, 1.0940, 1.0971, 1.1011, 1.1048, 1.1091, 1.1132-1.1140, 1.1189-1.1191, 1.1275-1.1292. On Wednesday, the unemployment rate will be released in the Eurozone, while in the US, the ADP report on changes in private-sector employment will be published.
Basic Rules of the Trading System:
- The strength of a signal is determined by the time it takes to form (bounce or break through a level). The less time it takes, the stronger the signal.
- If two or more trades were opened near a particular level based on false signals, all subsequent signals from that level should be ignored.
- In a flat market, any pair can generate a lot of false signals or none at all. In any case, it's best to stop trading at the first signs of a flat market.
- Trades should be opened during the period between the start of the European session and the middle of the US session, after which all trades should be manually closed.
- In the hourly time frame, it's preferable to trade based on MACD signals only when there is good volatility and a trend confirmed by a trendline or trend channel.
- If two levels are very close to each other (between 5 and 20 pips), they should be treated as a support or resistance zone.
- After a trade has moved 15 pips in the intended direction, set the Stop Loss to breakeven.
What's on the Charts:
Support and Resistance Price Levels: These levels serve as targets when opening buy or sell positions. They can also be used as points to set Take Profit levels.
Red Lines: These represent channels or trend lines that display the current trend and indicate the preferred trading direction.
MACD Indicator (14,22,3): The histogram and signal line serve as an auxiliary indicator that can also be used as a source of trading signals.
Important Speeches and Reports (always found in the news calendar) can significantly impact the movement of a currency pair. Therefore, trading should be done with maximum caution during their release, or you may choose to exit the market to avoid a sharp price reversal against the preceding movement.
For Beginners Trading on the Forex Market: It's essential to remember that not every trade will be profitable. Developing a clear strategy and practicing money management is key to achieving long-term success in trading.