signal strength 2 of 5

According to the chart of M15, EURCHF formed the Bearish Rectangle which is a pattern of a trend continuation. The pattern is contained within the following borders: lower border 0.9539 – 0.9539 and upper border 0.9558 – 0.9558. In case the lower border is broken, the instrument is likely to follow the downward trend.
The M5 and M15 time frames may have more false entry points.
See Also
- All
- Double Top
- Flag
- Head and Shoulders
- Pennant
- Rectangle
- Triangle
- Triple top
- All
- #AAPL
- #AMZN
- #Bitcoin
- #EBAY
- #FB
- #GOOG
- #INTC
- #KO
- #MA
- #MCD
- #MSFT
- #NTDOY
- #PEP
- #TSLA
- #TWTR
- AUDCAD
- AUDCHF
- AUDJPY
- AUDUSD
- EURCAD
- EURCHF
- EURGBP
- EURJPY
- EURNZD
- EURRUB
- EURUSD
- GBPAUD
- GBPCHF
- GBPJPY
- GBPUSD
- GOLD
- NZDCAD
- NZDCHF
- NZDJPY
- NZDUSD
- SILVER
- USDCAD
- USDCHF
- USDJPY
- USDRUB
- All
- M5
- M15
- M30
- H1
- D1
- All
- Buy
- Sale
- All
- 1
- 2
- 3
- 4
- 5
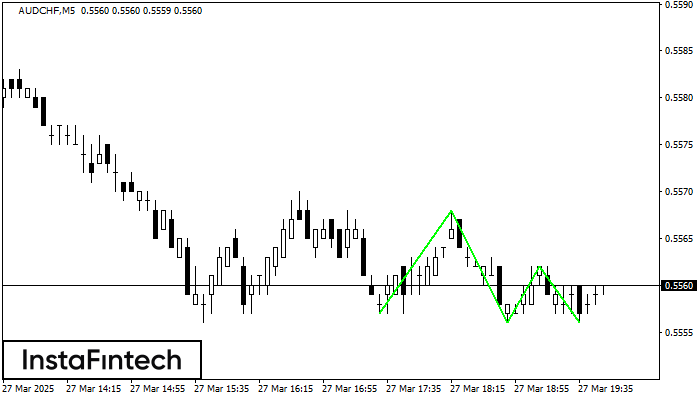
The Triple Bottom pattern has been formed on AUDCHF M5. It has the following characteristics: resistance level 0.5568/0.5562; support level 0.5557/0.5556; the width is 11 points. In the event
The M5 and M15 time frames may have more false entry points.
Open chart in a new window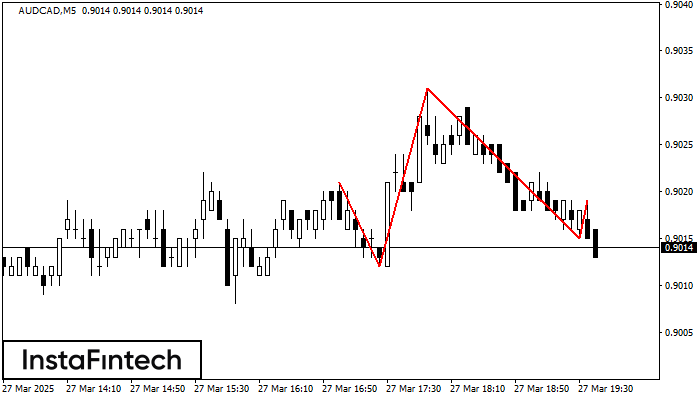
According to the chart of M5, AUDCAD formed the Head and Shoulders pattern. The Head’s top is set at 0.9031 while the median line of the Neck is found
The M5 and M15 time frames may have more false entry points.
Open chart in a new window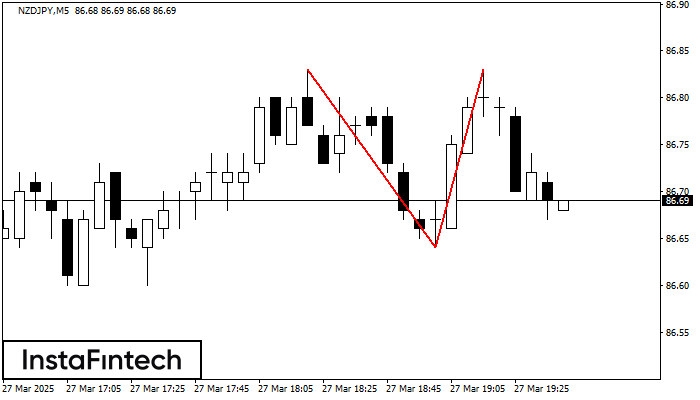
The Double Top reversal pattern has been formed on NZDJPY M5. Characteristics: the upper boundary 86.83; the lower boundary 86.64; the width of the pattern is 19 points. Sell trades
The M5 and M15 time frames may have more false entry points.
Open chart in a new window