signal strength 1 of 5
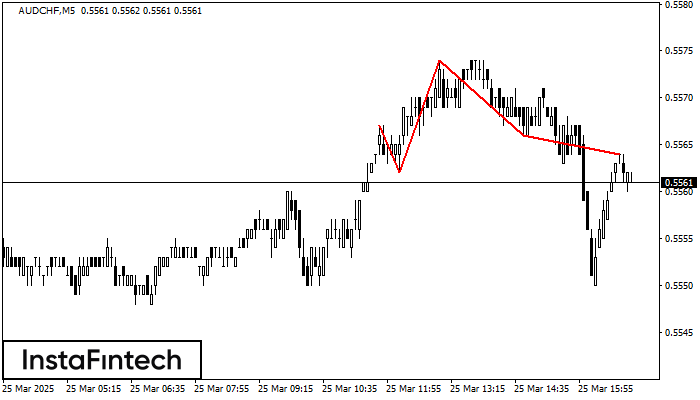
The technical pattern called Head and Shoulders has appeared on the chart of AUDCHF M5. There are weighty reasons to suggest that the price will surpass the Neckline 0.5562/0.5566 after the right shoulder has been formed. So, the trend is set to change with the price heading for 0.5551.
The M5 and M15 time frames may have more false entry points.
- All
- Double Top
- Flag
- Head and Shoulders
- Pennant
- Rectangle
- Triangle
- Triple top
- All
- #AAPL
- #AMZN
- #Bitcoin
- #EBAY
- #FB
- #GOOG
- #INTC
- #KO
- #MA
- #MCD
- #MSFT
- #NTDOY
- #PEP
- #TSLA
- #TWTR
- AUDCAD
- AUDCHF
- AUDJPY
- AUDUSD
- EURCAD
- EURCHF
- EURGBP
- EURJPY
- EURNZD
- EURRUB
- EURUSD
- GBPAUD
- GBPCHF
- GBPJPY
- GBPUSD
- GOLD
- NZDCAD
- NZDCHF
- NZDJPY
- NZDUSD
- SILVER
- USDCAD
- USDCHF
- USDJPY
- USDRUB
- All
- M5
- M15
- M30
- H1
- D1
- All
- Buy
- Sale
- All
- 1
- 2
- 3
- 4
- 5

Сформирована фигура «Тройное дно» по торговому инструменту NZDCAD на M5. Фигура сигнализирует об изменении тенденции с нисходящей на восходящую в случае пробоя верхней границы 0.8218
Таймфреймы М5 и М15 могут иметь больше ложных точек входа.
Открыть график инструмента в новом окне
По торговому инструменту NZDJPY на M15 была сформирована графическая фигура «Тройное дно» с характеристиками: Уровень сопротивления 84.47; Уровень поддержки 84.32; Ширина 15 пунктов. В случае пробоя уровня сопротивления 84.49 котировка
Таймфреймы М5 и М15 могут иметь больше ложных точек входа.
Открыть график инструмента в новом окне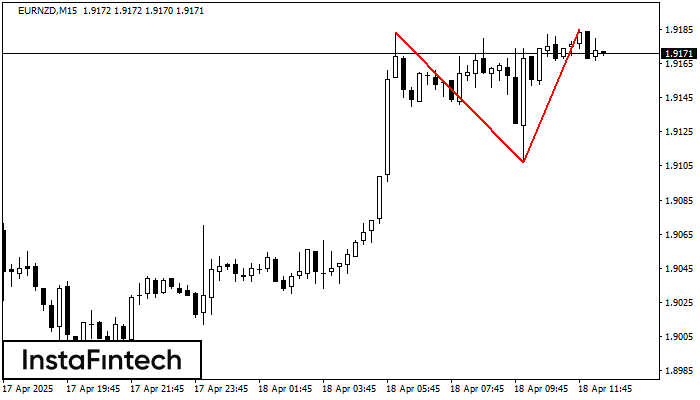
По EURNZD на M15 сформировалась разворотная фигура «Двойная вершина». Характеристика: Верхняя граница 1.9183; Нижняя граница 1.9107; Ширина фигуры 78 пунктов. Позицию на продажу возможно открыть ниже нижней границы 1.9107
Таймфреймы М5 и М15 могут иметь больше ложных точек входа.
Открыть график инструмента в новом окне