signal strength 2 of 5
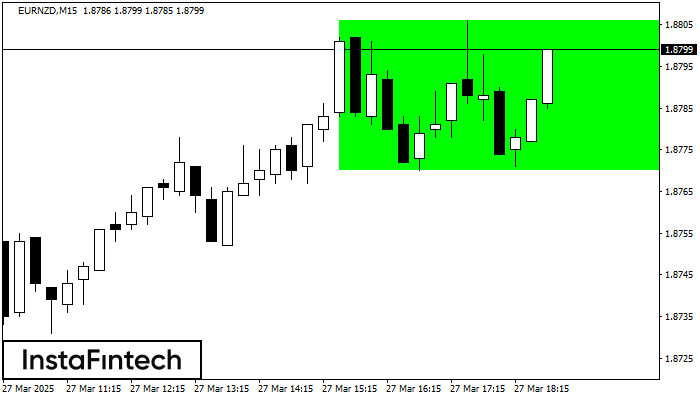
According to the chart of M15, EURNZD formed the Bullish Rectangle. The pattern indicates a trend continuation. The upper border is 1.8806, the lower border is 1.8770. The signal means that a long position should be opened above the upper border 1.8806 of the Bullish Rectangle.
The M5 and M15 time frames may have more false entry points.
انظر أيضا
- All
- Double Top
- Flag
- Head and Shoulders
- Pennant
- Rectangle
- Triangle
- Triple top
- All
- #AAPL
- #AMZN
- #Bitcoin
- #EBAY
- #FB
- #GOOG
- #INTC
- #KO
- #MA
- #MCD
- #MSFT
- #NTDOY
- #PEP
- #TSLA
- #TWTR
- AUDCAD
- AUDCHF
- AUDJPY
- AUDUSD
- EURCAD
- EURCHF
- EURGBP
- EURJPY
- EURNZD
- EURRUB
- EURUSD
- GBPAUD
- GBPCHF
- GBPJPY
- GBPUSD
- GOLD
- NZDCAD
- NZDCHF
- NZDJPY
- NZDUSD
- SILVER
- USDCAD
- USDCHF
- USDJPY
- USDRUB
- All
- M5
- M15
- M30
- H1
- D1
- All
- Buy
- Sale
- All
- 1
- 2
- 3
- 4
- 5
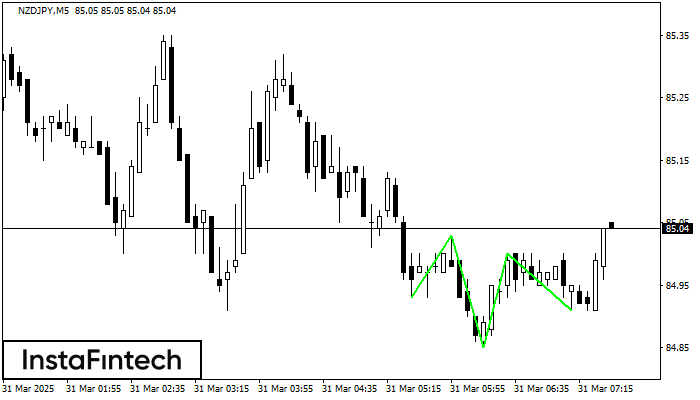
According to the chart of M5, NZDJPY formed the Inverse Head and Shoulder pattern. The Head’s top is set at 85.00 while the median line of the Neck is found
The M5 and M15 time frames may have more false entry points.
Open chart in a new window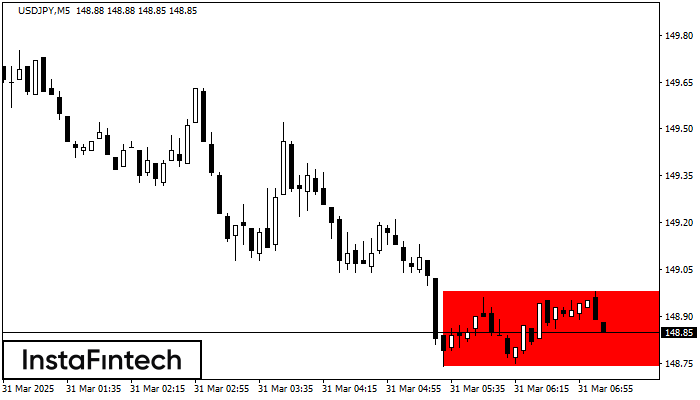
According to the chart of M5, USDJPY formed the Bearish Rectangle. The pattern indicates a trend continuation. The upper border is 148.98, the lower border is 148.74. The signal means
The M5 and M15 time frames may have more false entry points.
Open chart in a new window
The Double Bottom pattern has been formed on USDJPY M5. Characteristics: the support level 148.74; the resistance level 148.96; the width of the pattern 22 points. If the resistance level
The M5 and M15 time frames may have more false entry points.
Open chart in a new window