empty
30.03.2023 01:28 PM
Technical analysis of BTC/USD for March 30, 2023

This image is no longer relevant

Trading BTC/USD :

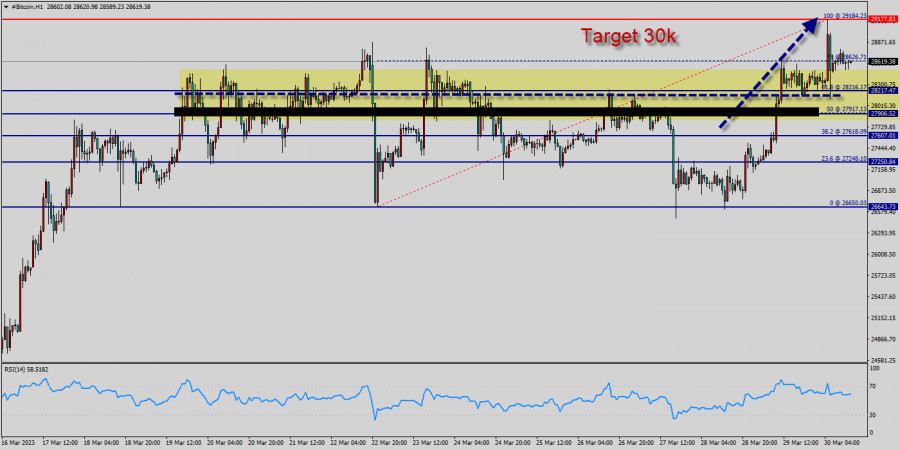
Bitcoin The bullish trend is currently very strong for BITCOIN - BTC/USD. As long as the price remains above the support at 28k USD, you could try to take advantage of the bullish rally in short term. The first bullish objective is located at 28,626 USD (this price is coincided with the ratio 78% of Fibonacci retracement levels).

The bullish momentum would be revived by a break in this resistance. Closing above the pivot point (28k USD) could assure that BTC/USD will move higher towards cooling new highs. The bulls must break through 29k USD in order to resume the up trend. Buyers would then use the next resistance located at 29,184 USD as an objective (this price is coincided with the ratio 100% of Fibonacci retracement levels - the double top - te last bullish wave on the hourly chart).

Crossing it would then enable buyers to target 29k USD. Be careful, given the powerful bullish rally underway, excesses could lead to a short-term rebound. Bitcoin's price has been consolidating between the 28k USD and 30k USD over the last few weeks, following a massive rising from the 28k USD mark.

So far, the price has been supported by the 28k USD - 27k USD range. If this is the case, remember that trading against the trend may be riskier. It would seem more appropriate to wait for a signal indicating reversal of the trend.

However, considering the current price action and the third rejection from this area, a run to the 29k USD support level and the 50-day moving average seems more likely. A bullish breakout from these levels would initiate a rally towards the 29k USD - 30k USD supply zone – a key level to which the price's reaction would determine the mid-term trend of the market.

In the very short term, the general bearish sentiment is confirmed by technical indicators. Nevertheless, a small upwards rebound in the very short term could occur in case of excessive bearish movements.

After finding bids reach to 29k USD, bitcoin price recovered above 26k USD, 27k USD and 28k USD. Initial Bitcoin resistance lies near the 28,626 USD level (78% of Fibonacci retracement levels).

A decent breakout and follow-up move above 28,626 USD could open the gate for a push towards the 29k USD level. The main resistance remains near the area of 29k USD - 30k USD.

Also it should be noted that Bitcoin and cryptocurrencies unite as the bears lose their momentum. The market is indicating a bullish opportunity above the above-mentioned support levels, for that the bullish outlook remains the same as long as the 100 EMA is headed to the upside.

Trading BTC/USD :

An uptrend will start as soon, as the market rises above resistance level 28k USD, which will be followed by moving up to resistance level 29k USD. Further close above the high end may cause a rally towards 30k USD. Nonetheless, the weekly resistance level and zone should be considered.

Mourad El Keddani,
الخبير التحليلي لدى شركة إنستافوركس
© 2007-2025
حدد الإطار الزمني
5
د
15
د
30
د
1
س
4
ساعات
1
يوم
1
أسبوع
كسب عائد من تغيرات أسعار العملات المشفرة مع إنستافوركس.
قم بتحميل منصة التداول ميتاتريدر 4 وافتح أول صفقة.
  • Grand Choice
    Contest by
    InstaForex
    InstaForex always strives to help you
    fulfill your biggest dreams.
    انضم إلى المسابقة

المقالات الموصى بها

توقعات اليورو/الدولار الأمريكي ليوم 2 أبريل 2025

بحلول نهاية يوم أمس، انخفض اليورو بمقدار 25 نقطة، لكن شهية المخاطرة في السوق استمرت في النمو: ارتفع مؤشر S&P 500 بنسبة 0.38%، وظل عائد السندات الحكومية الأمريكية لأجل

Laurie Bailey 04:49 2025-04-02 UTC+2

توقعات GBP/USD ليوم 2 أبريل 2025

أظهرت بيانات الأمس حول نشاط التصنيع في المملكة المتحدة لشهر مارس انخفاضًا من 46.9 إلى 44.9. وعلى خلفية تراجع المؤشر الأمريكي من 52.7 إلى 50.2، يبدو الانخفاض في المؤشر البريطاني

Laurie Bailey 04:49 2025-04-02 UTC+2

توقعات البيتكوين ليوم 2 أبريل 2025

بيتكوين (BTC) بعد الوصول إلى مستوى الدعم 81,231 (الحد الأدنى التقريبي من 4 و18 مارس)، اقترب السعر من خط MACD (86,038). اختراق هذا الخط سيسمح بمزيد من النمو نحو مستوى

Laurie Bailey 04:49 2025-04-02 UTC+2

إشارات التداول لليورو/الدولار الأمريكي للفترة من 1 إلى 3 أبريل 2025: بيع تحت 1.0804 (21 SMA - 8/8 Murray)

في بداية الجلسة الأمريكية، يتداول اليورو حول 1.0791، حيث يخضع لتصحيح تقني بعد أن وصل إلى قمة قناة الاتجاه الهابط التي تشكلت في 14 مارس، ويظهر علامات على الإرهاق. يواجه

Dimitrios Zappas 15:06 2025-04-01 UTC+2

إشارات التداول للذهب (XAU/USD) للفترة من 1 إلى 3 أبريل 2025: بيع تحت مستوى 3,144 دولار (21 SMA - 8/8 Murray)

من ناحية أخرى، إذا استقر السعر تحت مستوى 8/8 Murray عند 3,125، فإن التوقعات ستكون سلبية. لذا، نعتقد أن الأداة قد تصل إلى 3,091 على المدى القصير ومن ثم ترتفع

Dimitrios Zappas 15:04 2025-04-01 UTC+2

توقعات الفوركس 01/04/2025: اليورو/الدولار الأمريكي، الدولار الأسترالي/الدولار الأمريكي، الدولار النيوزيلندي/الدولار الأمريكي، SP500 وبيتكوين

روابط مفيدة: مقالاتي الأخرى متوفرة في هذا القسم دورة InstaForex للمبتدئين التحليلات الشائعة افتح حساب تداول مهم: يجب على المبتدئين في تداول الفوركس أن يكونوا حذرين للغاية عند اتخاذ قرارات

Sebastian Seliga 11:43 2025-04-01 UTC+2

اليورو/الدولار الأمريكي. 1 أبريل. المتداولون في حيرة وغير راغبين في المخاطرة

يوم الاثنين، واصل زوج اليورو/الدولار الأمريكي حركته الصعودية وحتى ارتد من منطقة الدعم عند 1.0781–1.0797. ومع ذلك، أصبح من الصعب بشكل متزايد الإيمان بارتفاع إضافي لليورو. وفقًا لتحليل الموجات، تحول

Samir Klishi 11:32 2025-04-01 UTC+2

GBP/USD. 1 أبريل. شهر من الحركة الجانبية وتهديد بفرض تعريفات جديدة

على الرسم البياني لكل ساعة، استمر زوج الجنيه الإسترليني/الدولار الأمريكي في التداول بشكل جانبي يوم الاثنين. حاليًا، لا يوجد سيطرة لأي من الثيران أو الدببة في السوق

Samir Klishi 11:29 2025-04-01 UTC+2

توقعات EUR/USD ليوم 1 أبريل 2025

بدأ الذعر في سوق الأسهم في التراجع. بالأمس، بحلول نهاية الجلسة، سجلت المؤشرات الرئيسية مكاسب. تراجع اليورو بمقدار 11 نقطة. ومن الجدير بالذكر أنه بحلول هذا الوقت، استقرت خط الإشارة

Laurie Bailey 10:47 2025-04-01 UTC+2

توقعات GBP/USD ليوم 1 أبريل 2025

GBP/USD لم يتبق سوى يوم واحد قبل أن يفرض الرئيس ترامب تعريفات موسعة على جميع الشركاء التجاريين "غير العادلين" للولايات المتحدة. لا يزال الجنيه الإسترليني غير مؤكد بشأن موقف المملكة

Laurie Bailey 10:42 2025-04-01 UTC+2
لا تستطيع التحدث الآن؟
اطرح سؤالك في الدردشة.
Widget callback
 

Dear visitor,

Your IP address shows that you are currently located in the USA. If you are a resident of the United States, you are prohibited from using the services of InstaFintech Group including online trading, online transfers, deposit/withdrawal of funds, etc.

If you think you are seeing this message by mistake and your location is not the US, kindly proceed to the website. Otherwise, you must leave the website in order to comply with government restrictions.

Why does your IP address show your location as the USA?

  • - you are using a VPN provided by a hosting company based in the United States;
  • - your IP does not have proper WHOIS records;
  • - an error occurred in the WHOIS geolocation database.

Please confirm whether you are a US resident or not by clicking the relevant button below. If you choose the wrong option, being a US resident, you will not be able to open an account with InstaForex anyway.

We are sorry for any inconvenience caused by this message.